Power BI Sales Dashboard
This interactive dashboard empowers businesses to visualize and analyze internet sales and customer data, driving better decisions with live metrics.
Features & Functionality
- Integration: Merged data from Excel and CRM for unified insights.
- Visualization: Dynamic charts & filters for products, customers, and sales reps.
- Ease of Use: Simple drag-and-drop interface for building visual reports.
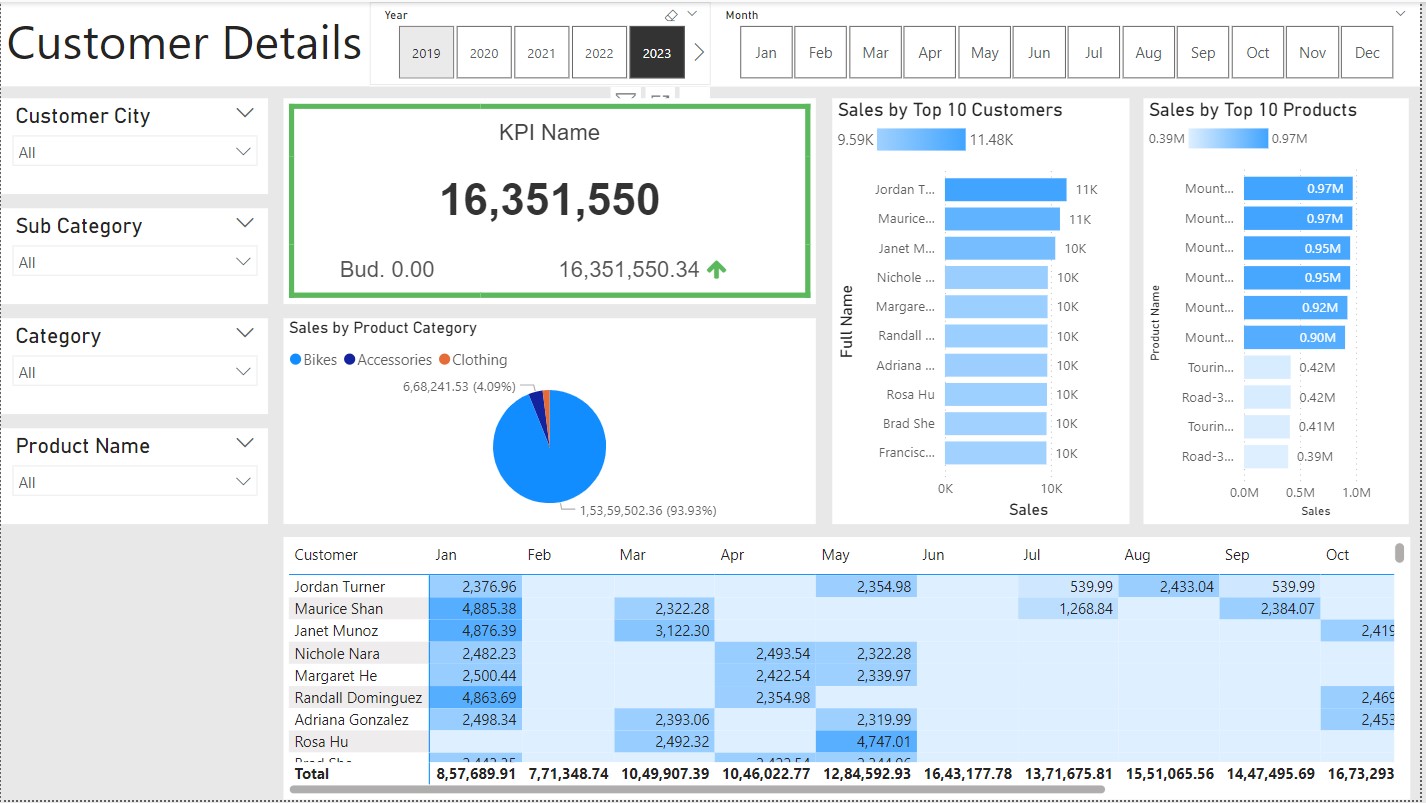
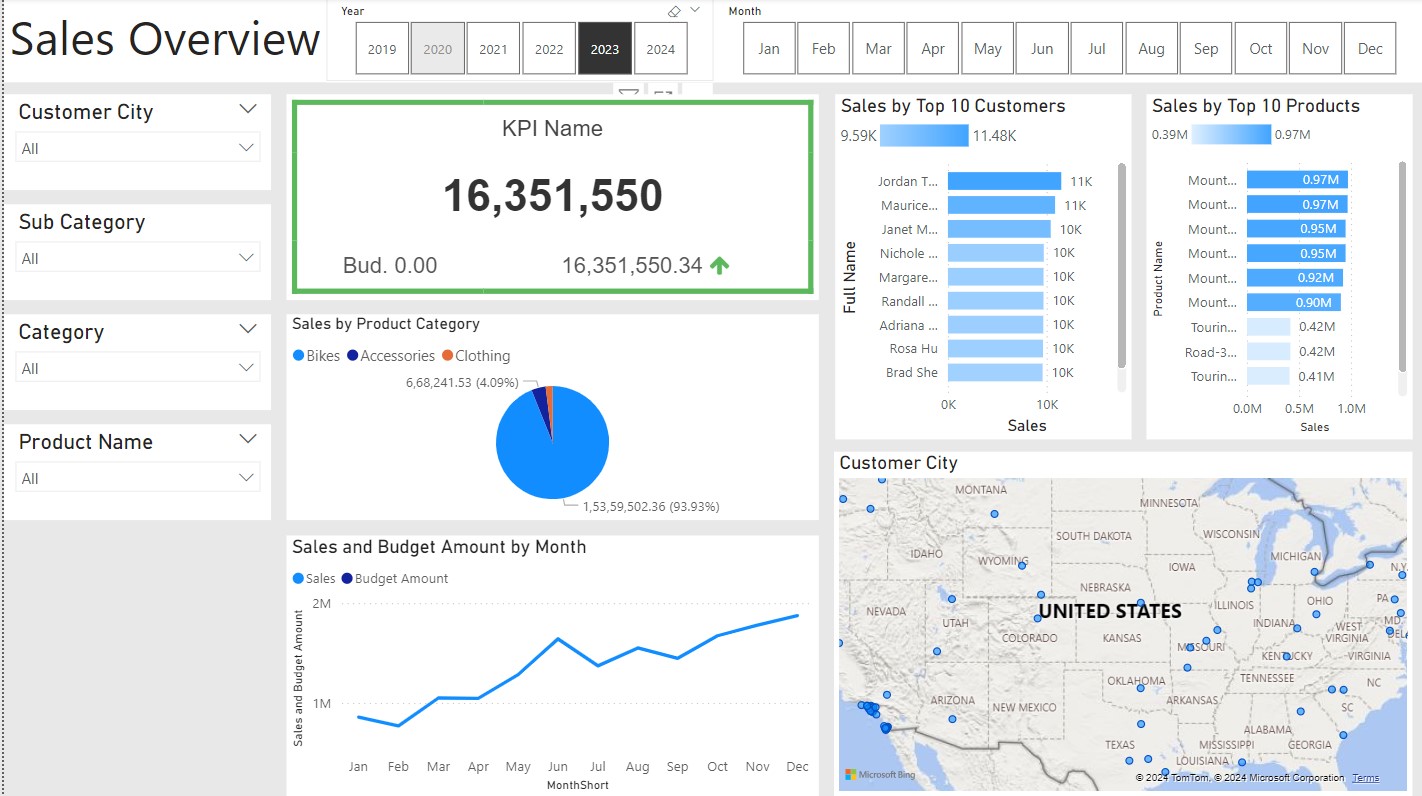
- Sales Overview: Track KPIs, top products, and sales trends.
- Customer Drill-down: Identify loyal buyers and personalize engagement.